Finance Facts & Tax Calculator
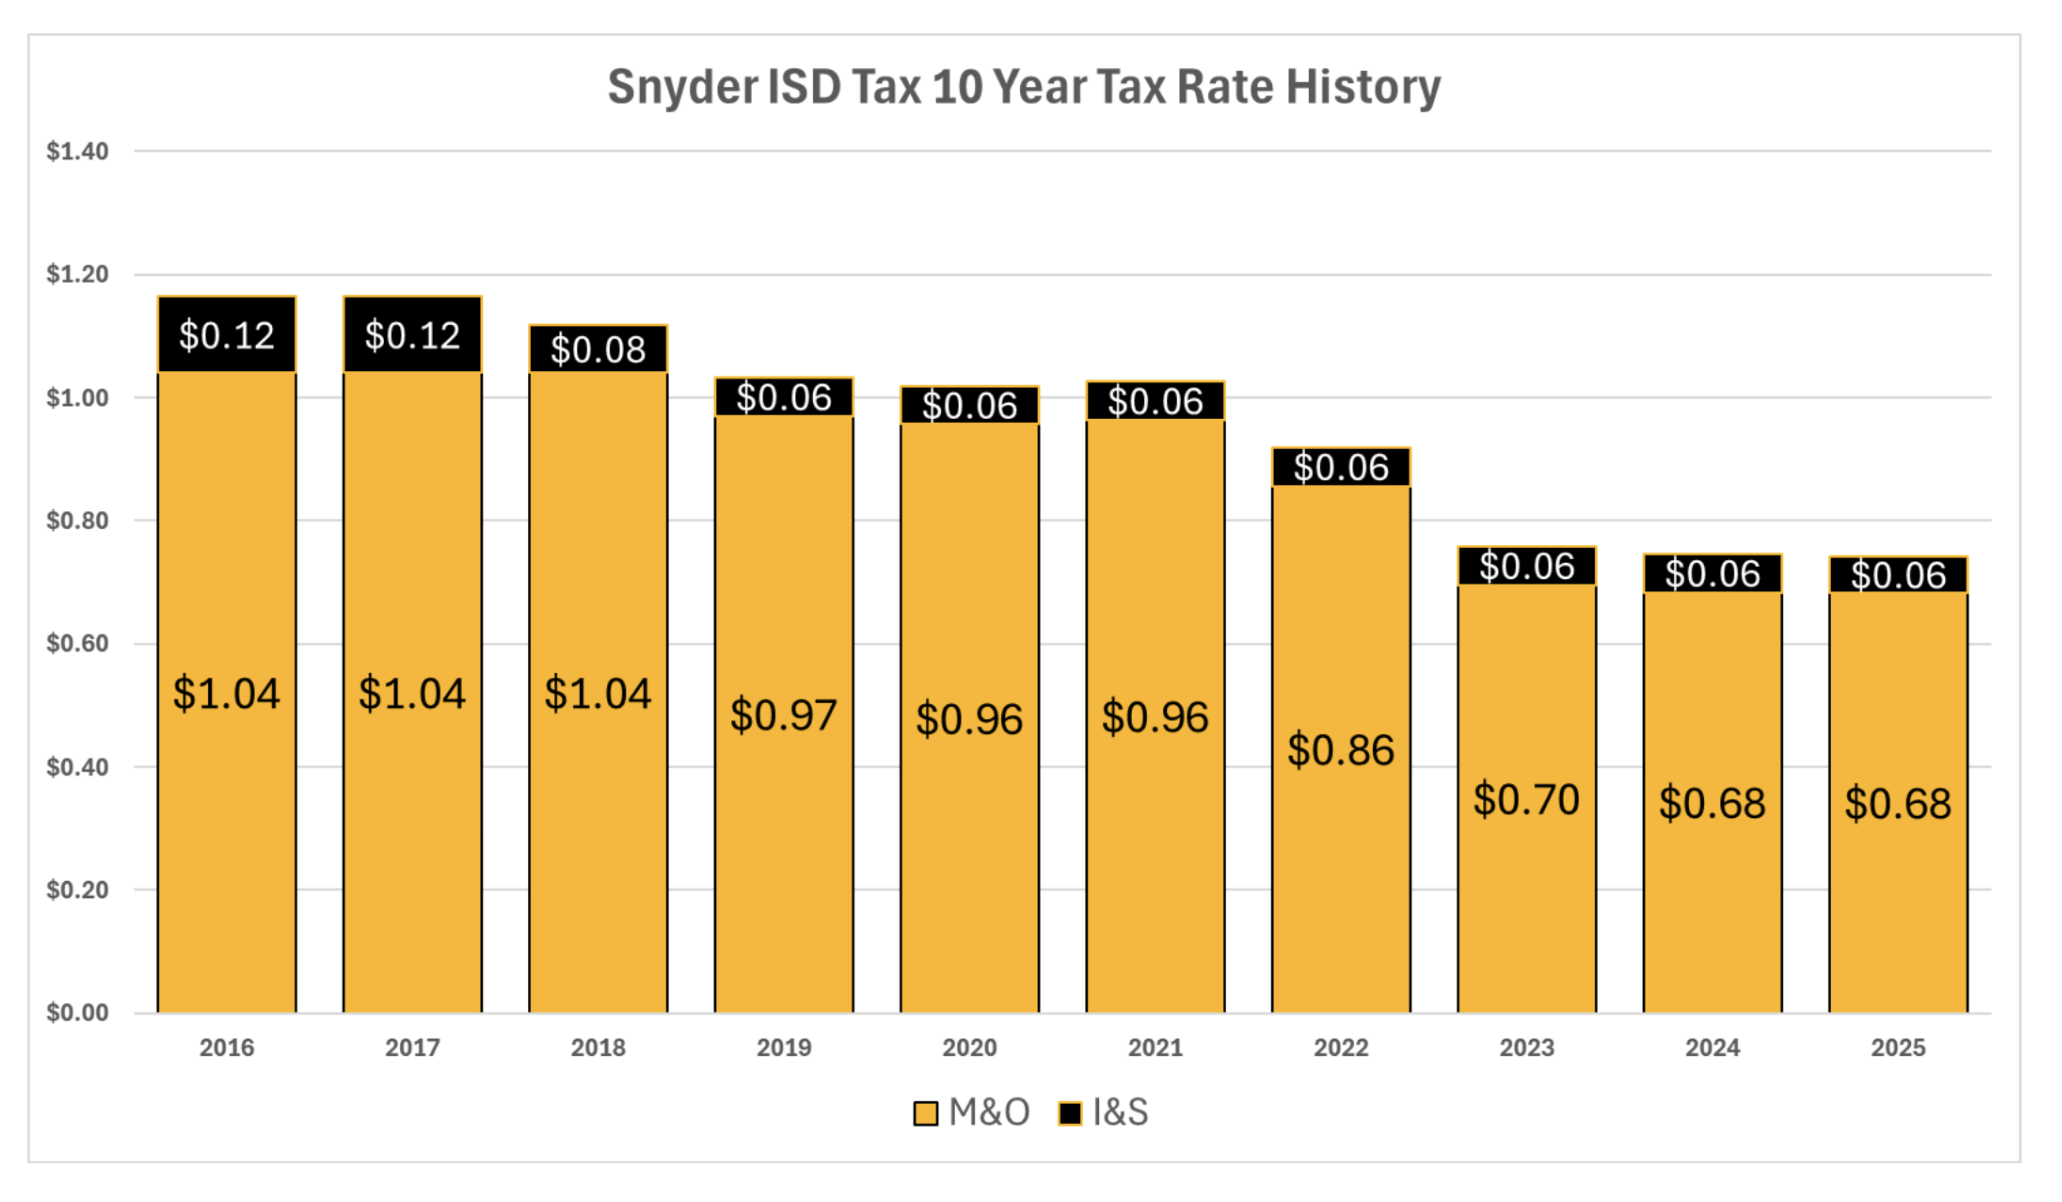
10 -Year Tax Rate History for Snyder ISD
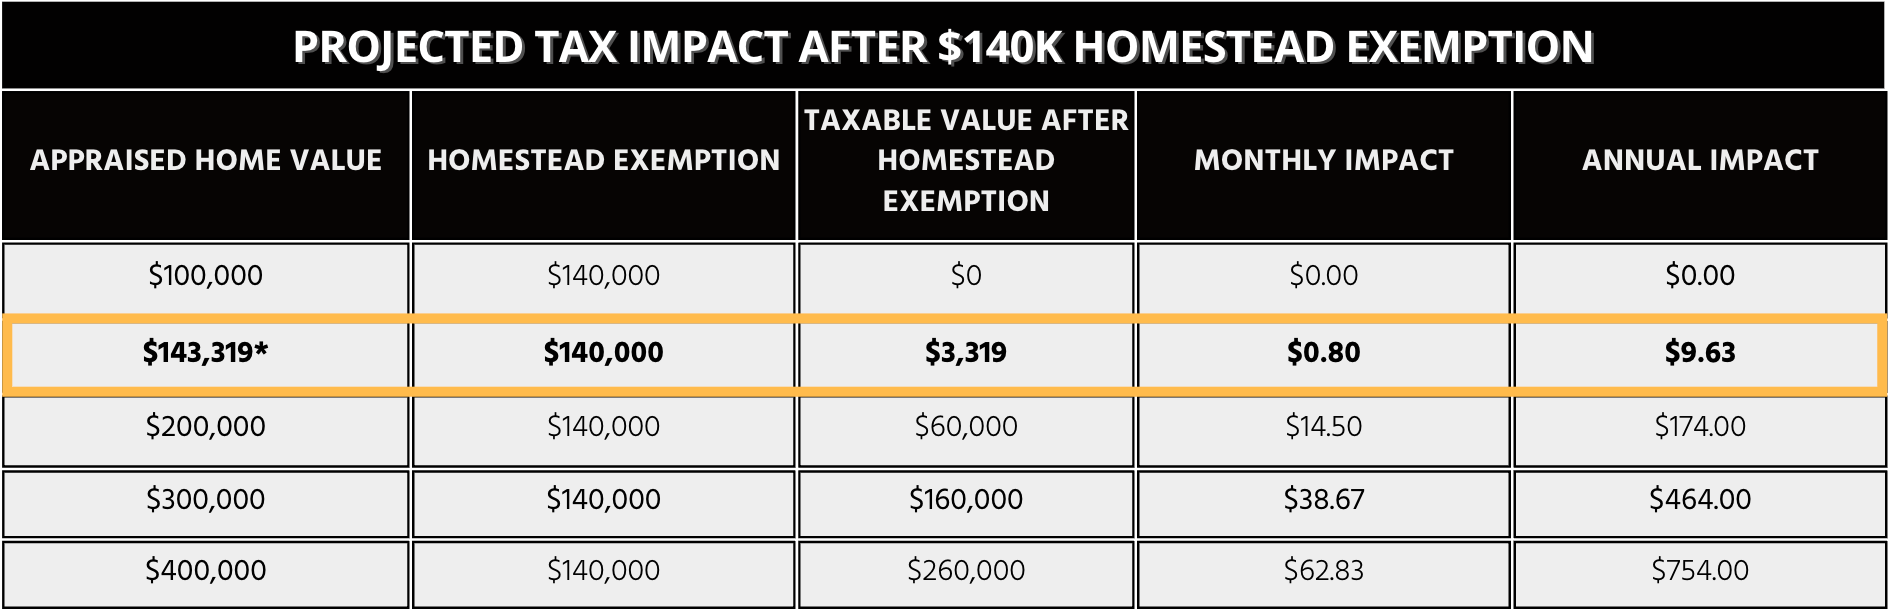
*Average home value in Snyder ISD $143,319 (Source Scurry CAD, 2025, Cat. A&E)
*Category A & E includes 3,401 residences
*Contingent on Proposition 13 passing in November 2025
Regional Comparison
How does Snyder ISD currently compare to similar-sized districts in the region with regard to bond dollars spent and total tax rates?
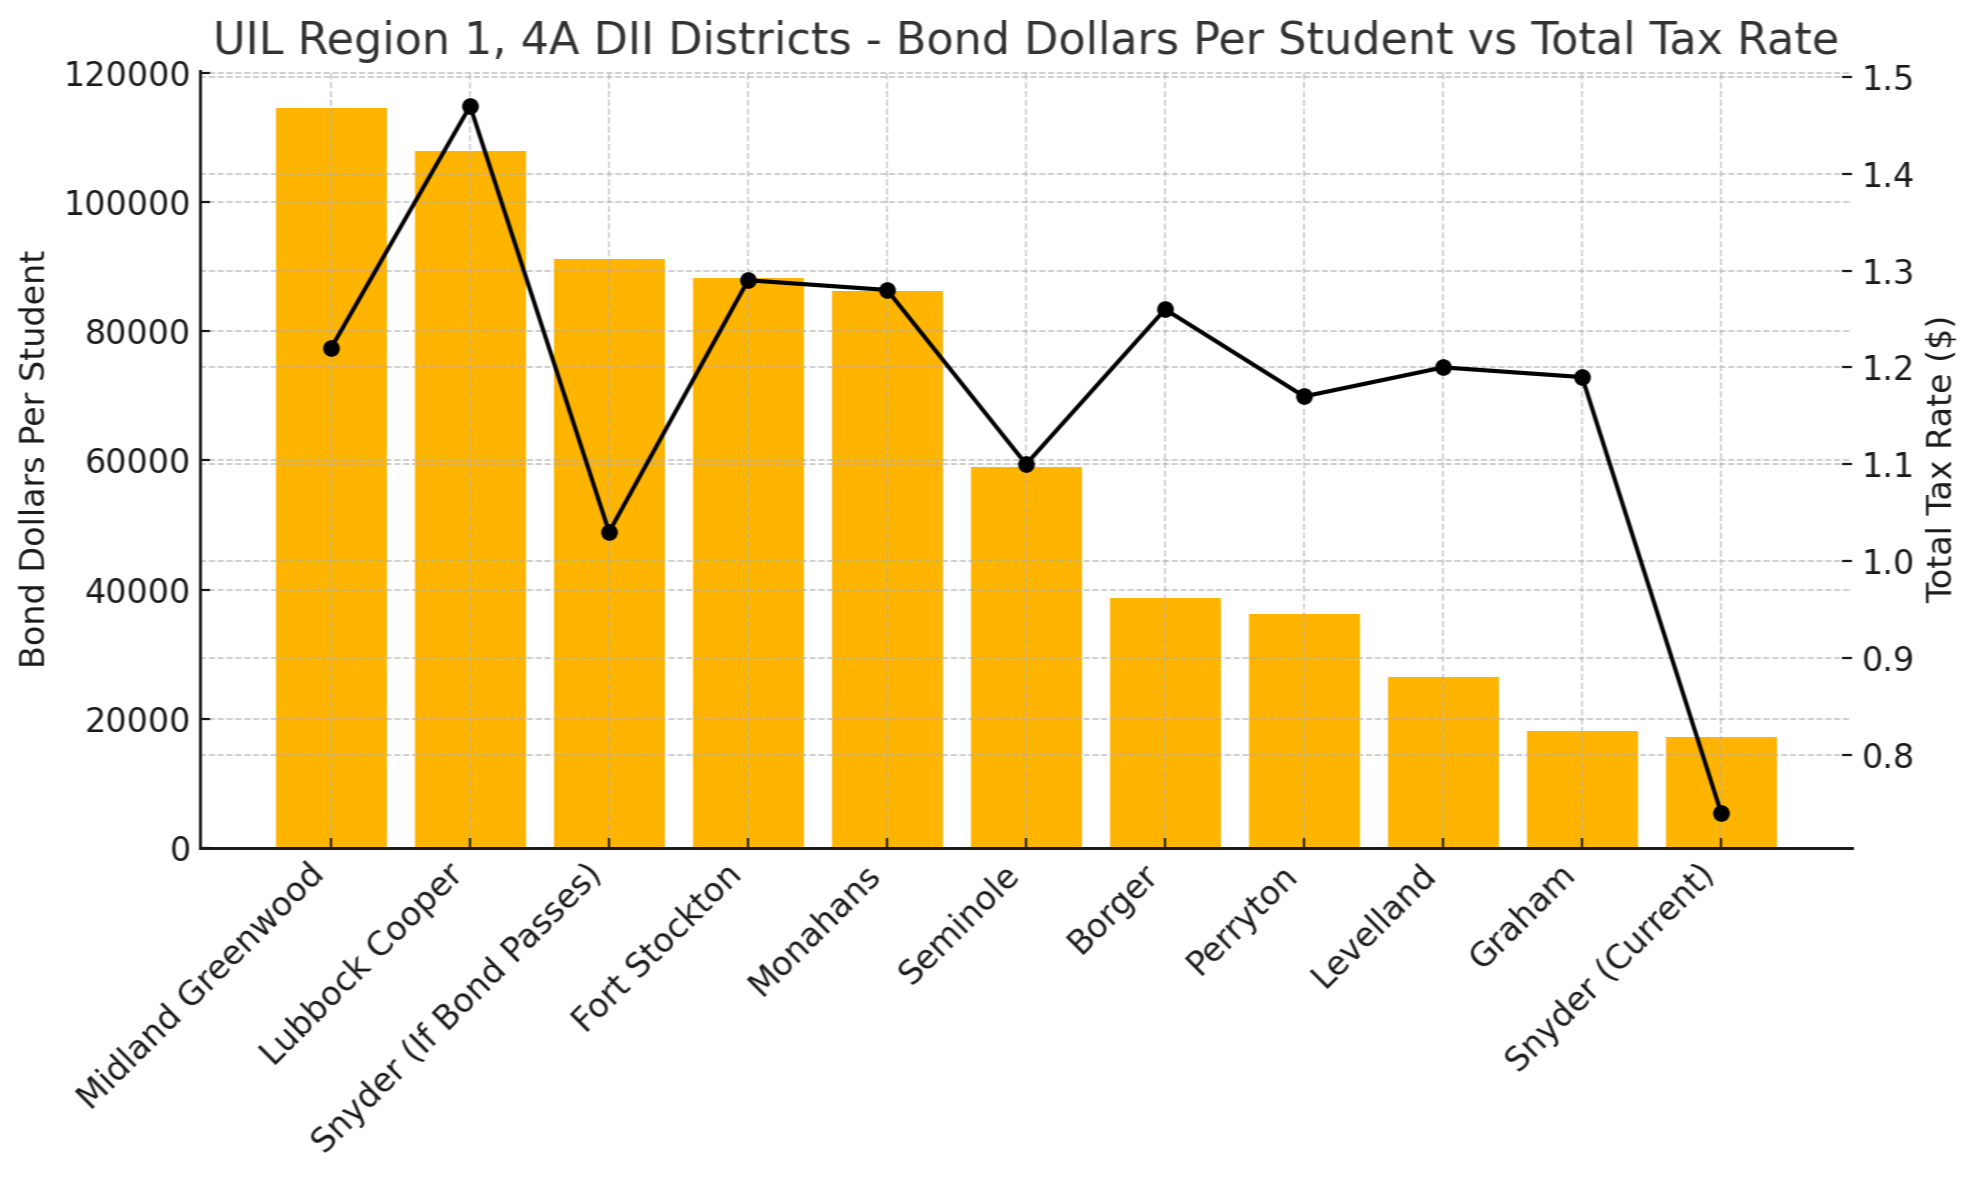
Bond Dollars Per Student – UIL Region 1, 4A Division II (Descending Order) Amounts reflect data available at the time of website publication | ||||||||
|---|---|---|---|---|---|---|---|---|
District | Tax Base | Enrollment | M&O Tax Rate | I&S Tax Rate | Total Tax Rate | Bond Amounts Passed Since 2000 | Bond Dollars Per Student | District |
Lubbock Cooper | $5.24B | 7,474 | $0.97 | $0.50 | $1.47 | $806,200,000 | $107,832 | Lubbock Cooper |
Fort Stockton | $3.78B | 1,937 | $0.94 | $0.35 | $1.29 | $170,790,000 | $88,161 | Fort Stockton |
Monahans | $4.47B | 1,966 | $0.94 | $0.34 | $1.28 | $169,500,000 | $86,220 | Monahans |
Borger | $1.13B | 2,085 | $0.85 | $0.41 | $1.26 | $80,747,500 | $38,717 | Borger |
Midland Greenwood | $5.98B | 3,087 | $0.92 | $0.30 | $1.22 | $353,785,000 | $114,600 | Midland Greenwood |
Levelland | $1.60B | 2,318 | $0.94 | $0.26 | $1.20 | $61,470,000 | $26,524 | Levelland |
Graham | $1.07B | 2,042 | $0.88 | $0.31 | $1.19 | $36,900,000 | $18,073 | Graham |
Perryton | $1.18B | 1,638 | $0.91 | $0.26 | $1.17 | $59,458,750 | $36,300 | Perryton |
Seminole | $4.30B | 2,809 | $0.97 | $0.13 | $1.10 | $165,900,000 | $59,058 | Seminole |
Snyder (If Bond Passes) | $3.92B | 2,307 | $0.68 | $0.35 | $1.03 | $210,485,424 | $91,238 | Snyder (If Bond Passes) |
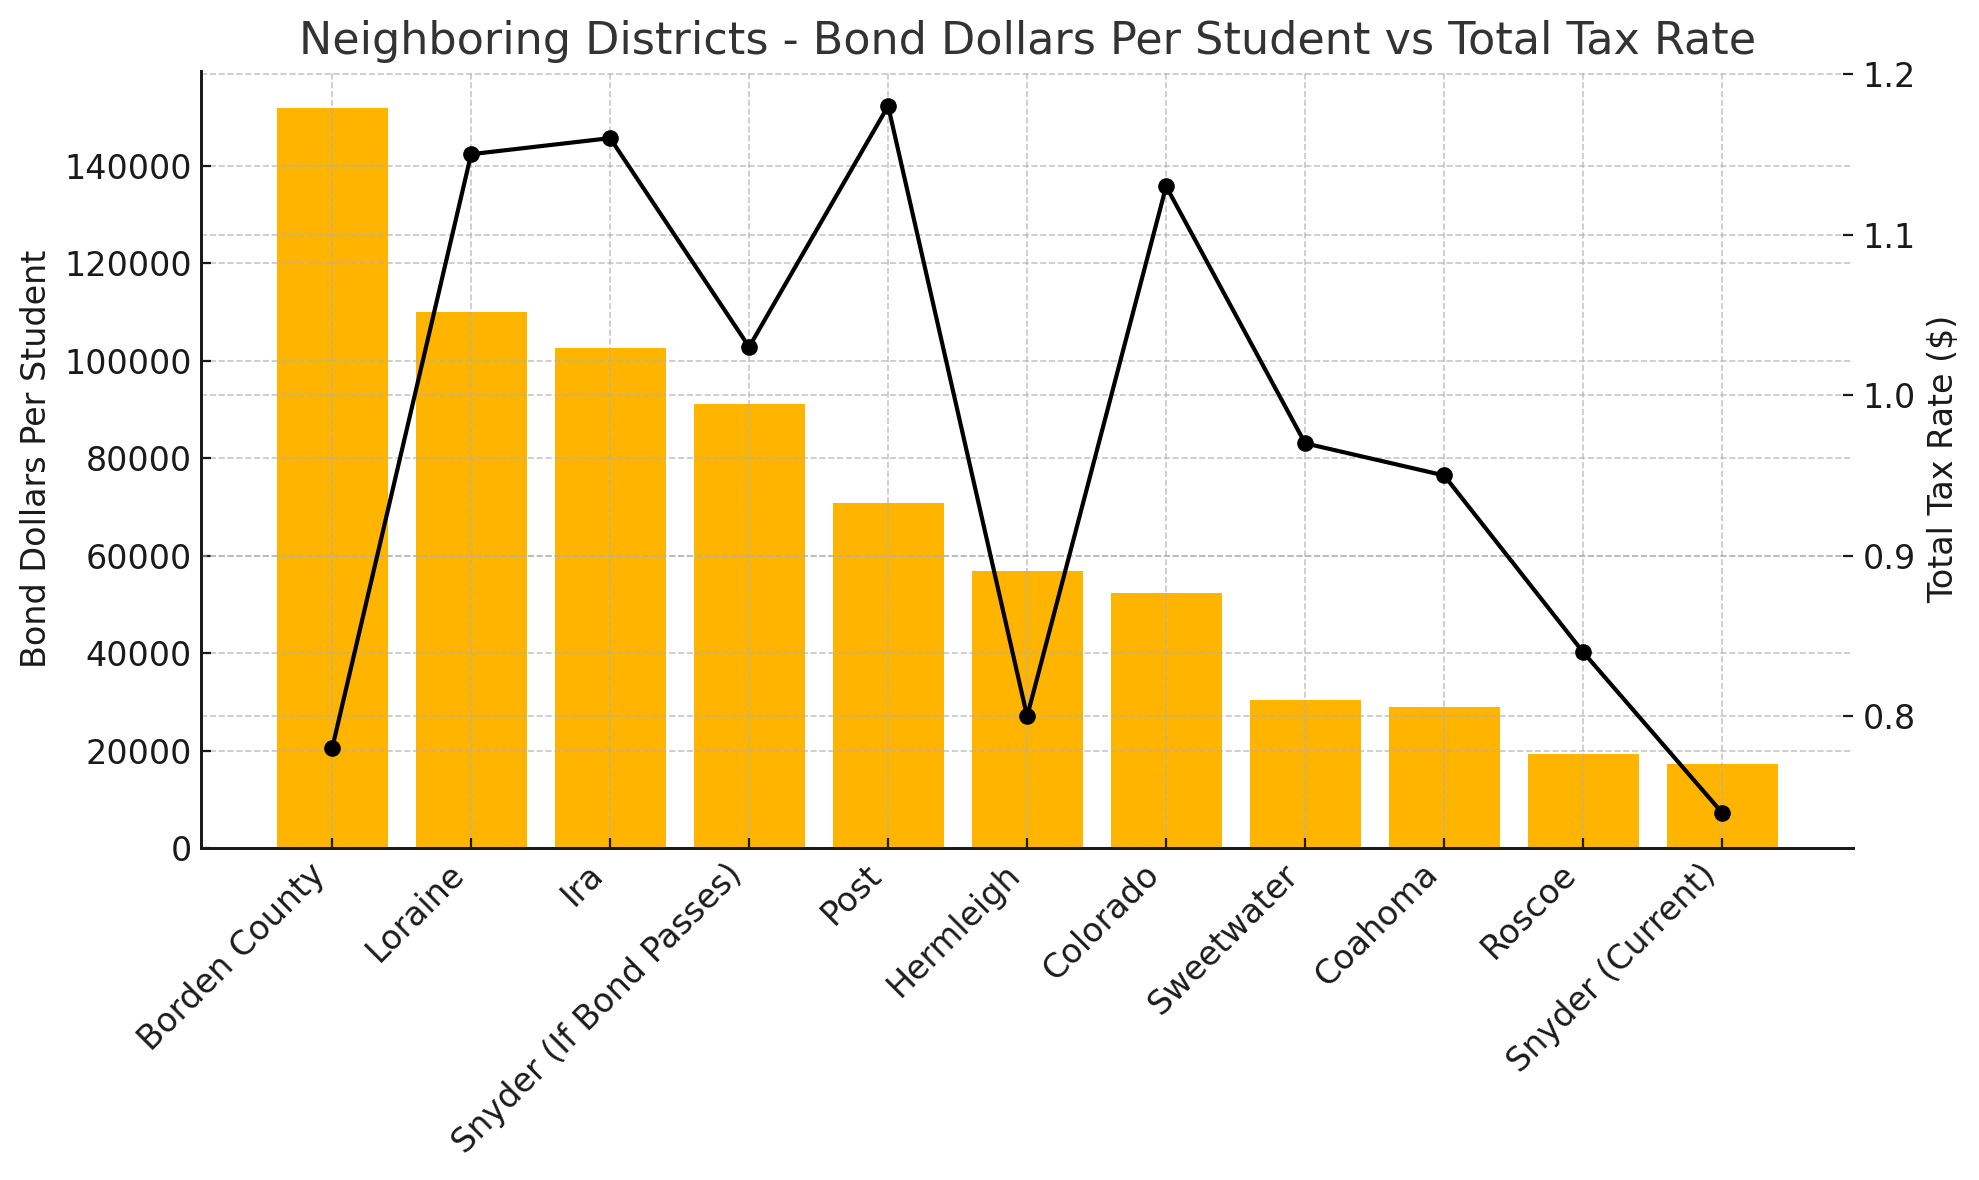
Total Tax Rate Comparison– Neighboring Districts Amounts reflect data available at the time of website publication | |||||||
|---|---|---|---|---|---|---|---|
District | Tax Base | Enrollment | M&O Tax Rate | I&S Tax Rate | Total Tax Rate | Bond Amounts Passed Since 2000 | Bond Dollars Per Student |
Post | $506.1M | 656 | $0.68 | $0.50 | $1.18 | $46,480,000 | $70,854 |
Ira | $398.6M | 265 | $0.67 | $0.49 | $1.16 | $27,200,000 | $102,642 |
Loraine | $175.8M | 109 | $0.73 | $0.42 | $1.15 | $12,000,000 | $110,092 |
Colorado | $631.5M | 788 | $0.79 | $0.34 | $1.13 | $41,215,000 | $52,324 |
Snyder (If Bond Passes) | $3.92B | 2,307 | $0.68 | $0.35 | $1.03 | $210,485,434 | $91,238 |
Sweetwater | $1.31B | 1,660 | $0.71 | $0.26 | $0.97 | $50,500,000 | $30,422 |
Coahoma | $2.14B | 1,042 | $0.70 | $0.25 | $0.95 | $30,165,000 | $28,939 |
Roscoe | $489.8M | 550 | $0.78 | $0.06 | $0.84 | $10,600,000 | $19,273 |
Hermleigh | $671.5M | 220 | $0.67 | $0.13 | $0.80 | $12,500,000 | $56,818 |
Borden County | $1.35B | 204 | $0.70 | $0.08 | $0.78 | $31,000,000 | $151,961 |
Snyder (Current) | $3.92B | 2,307 | $0.68 | $0.06 | $0.74 | $39,585,000 | $17,159 |
Key Takeaways
Snyder ISD has one of the largest tax bases in the area ($3.92B) but ranks near the bottom in bond dollars per student.
Neighboring districts like Post ($70,854 per student, $0.50 I&S) and Ira ($102,642 per student, $0.49 I&S) have spent multiples more in bond dollars per student (referenced in Tax Q&A section below).
Snyder maintains one of the lowest tax rates in the group (M&O at $0.68 and I&S at $0.06).
Among UIL Region 1, 4A DII peers, Snyder also ranks near the bottom in historical bond investment while maintaining one of the lowest combined tax rates.
If the proposed $170.9M bond passes, Snyder’s total would increase to roughly $91,238 per student, positioning the district closer to the regional median while still below many fast-growth districts.
For a full list of financial impact questions & answers visit our FAQ page.
Recapture in Snyder ISD
Snyder ISD has paid $75,655,000 in recapture over the last 15 years. I&S (bond) revenues are not subject to recapture and remain entirely local.
Voters over 65 Homestead Exemption
Residents 65 and over are eligible for an “over 65” exemption. If you have applied for and received the age 65 and older exemption on your homestead, by law, your school taxes cannot be raised above their frozen level. The amount of taxes you pay is determined by the tax amount at the time your taxes were frozen, unless you make significant improvements to the home, in which case the tax ceiling may go higher.